
Welcome to Arrived’s Q1 2025 review! Let’s review the dividends and appreciation ranges of the 487 Arrived properties operating during Q1 2025.
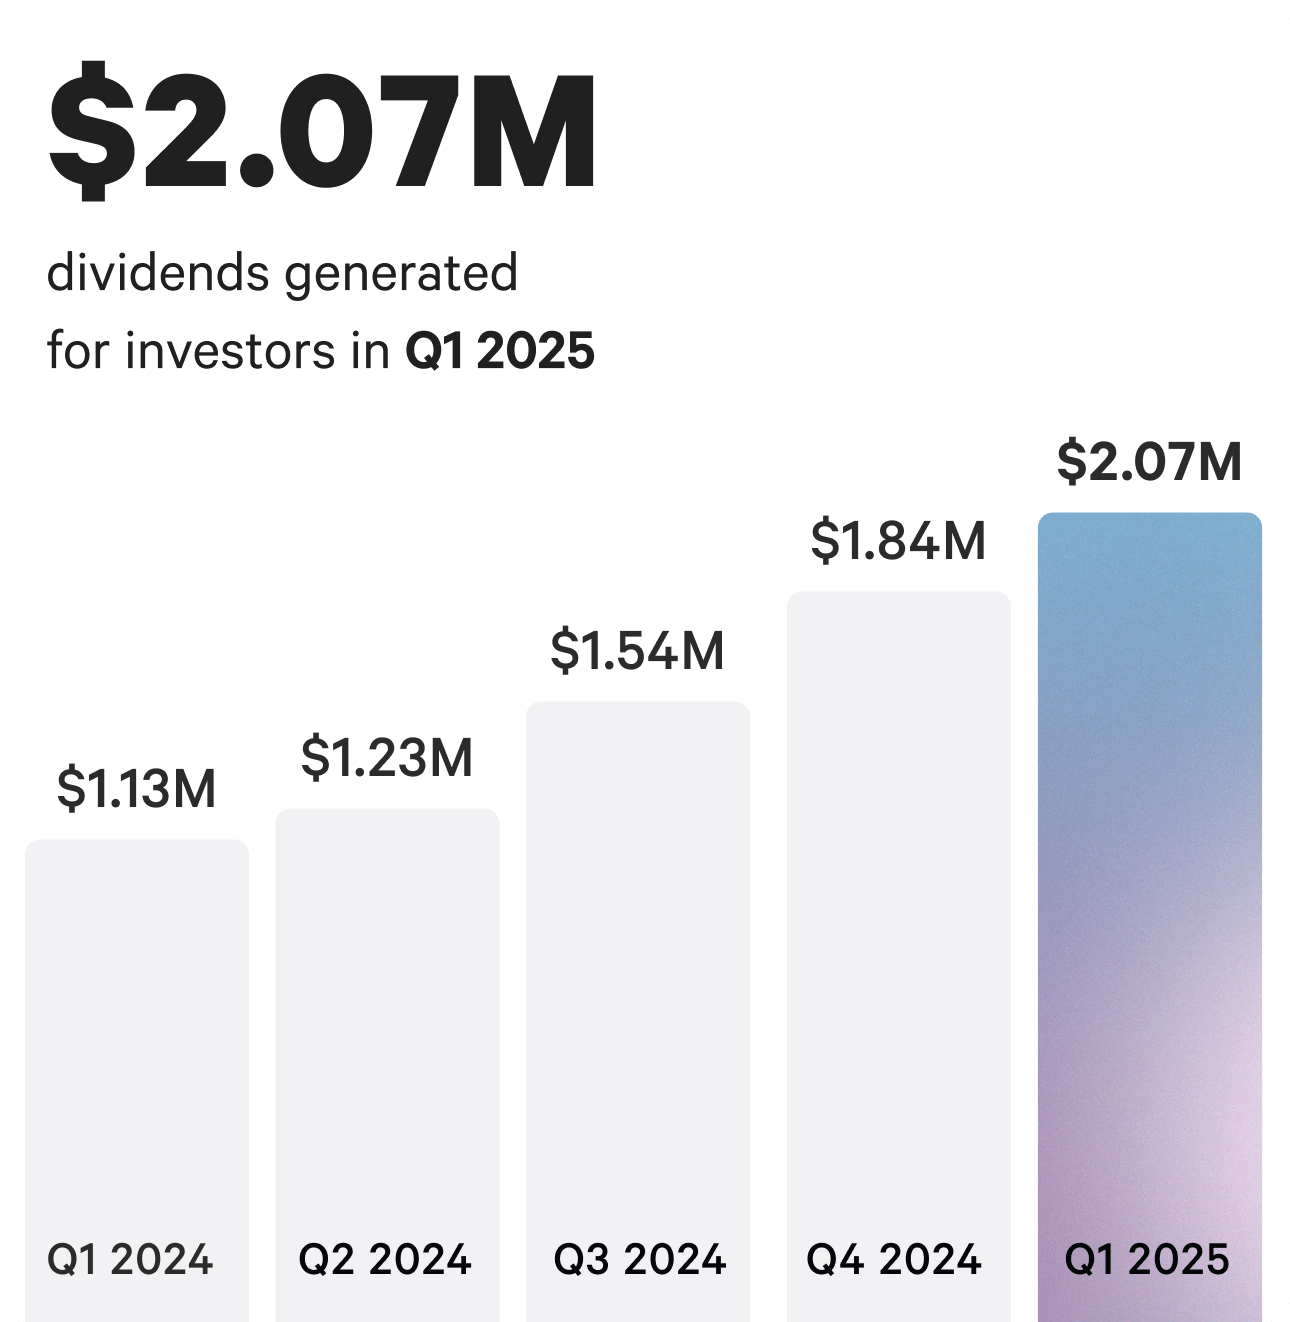
In Q1 2025, investors earned more than $2.07M in dividend income, an increase of approximately 13% from Q4 2024. In Q1 2025, individual single family residential properties earned an average annualized dividend of 3.9%, and vacation rental homes earned an average of 2.3%.
This quarter, we’ve rolled out powerful new tools to help you better track your portfolio—including a map view, monthly account statements, and two key performance metrics: Property Value and Arrived Valuation, now featured in your Portfolio Page and quarterly updates.
Dividends
Dividends earned can vary by investment. In Q1 2025, individual single family residential properties paid an annualized dividend between 0.3% and 10.6%¹, with a 3.9% average. Vacation rentals paid an annualized dividend between 1.2% and 7.3%, with an average of 2.3%¹.
The Arrived Single Family Residential Fund paid an annualized dividend of 4%, and the Arrived Real Estate Income Fund generated income, resulting in an annualized dividend of 8.1% for Q1.
You can view the dividends for each property on our Historical Returns page.

The annualized dividend for each property is calculated by taking the Q1 dividend and extrapolating it out for an entire year. Building a diversified portfolio across multiple markets can be a great strategy to minimize concentration risk while getting exposure to different real estate markets and earning passive income.
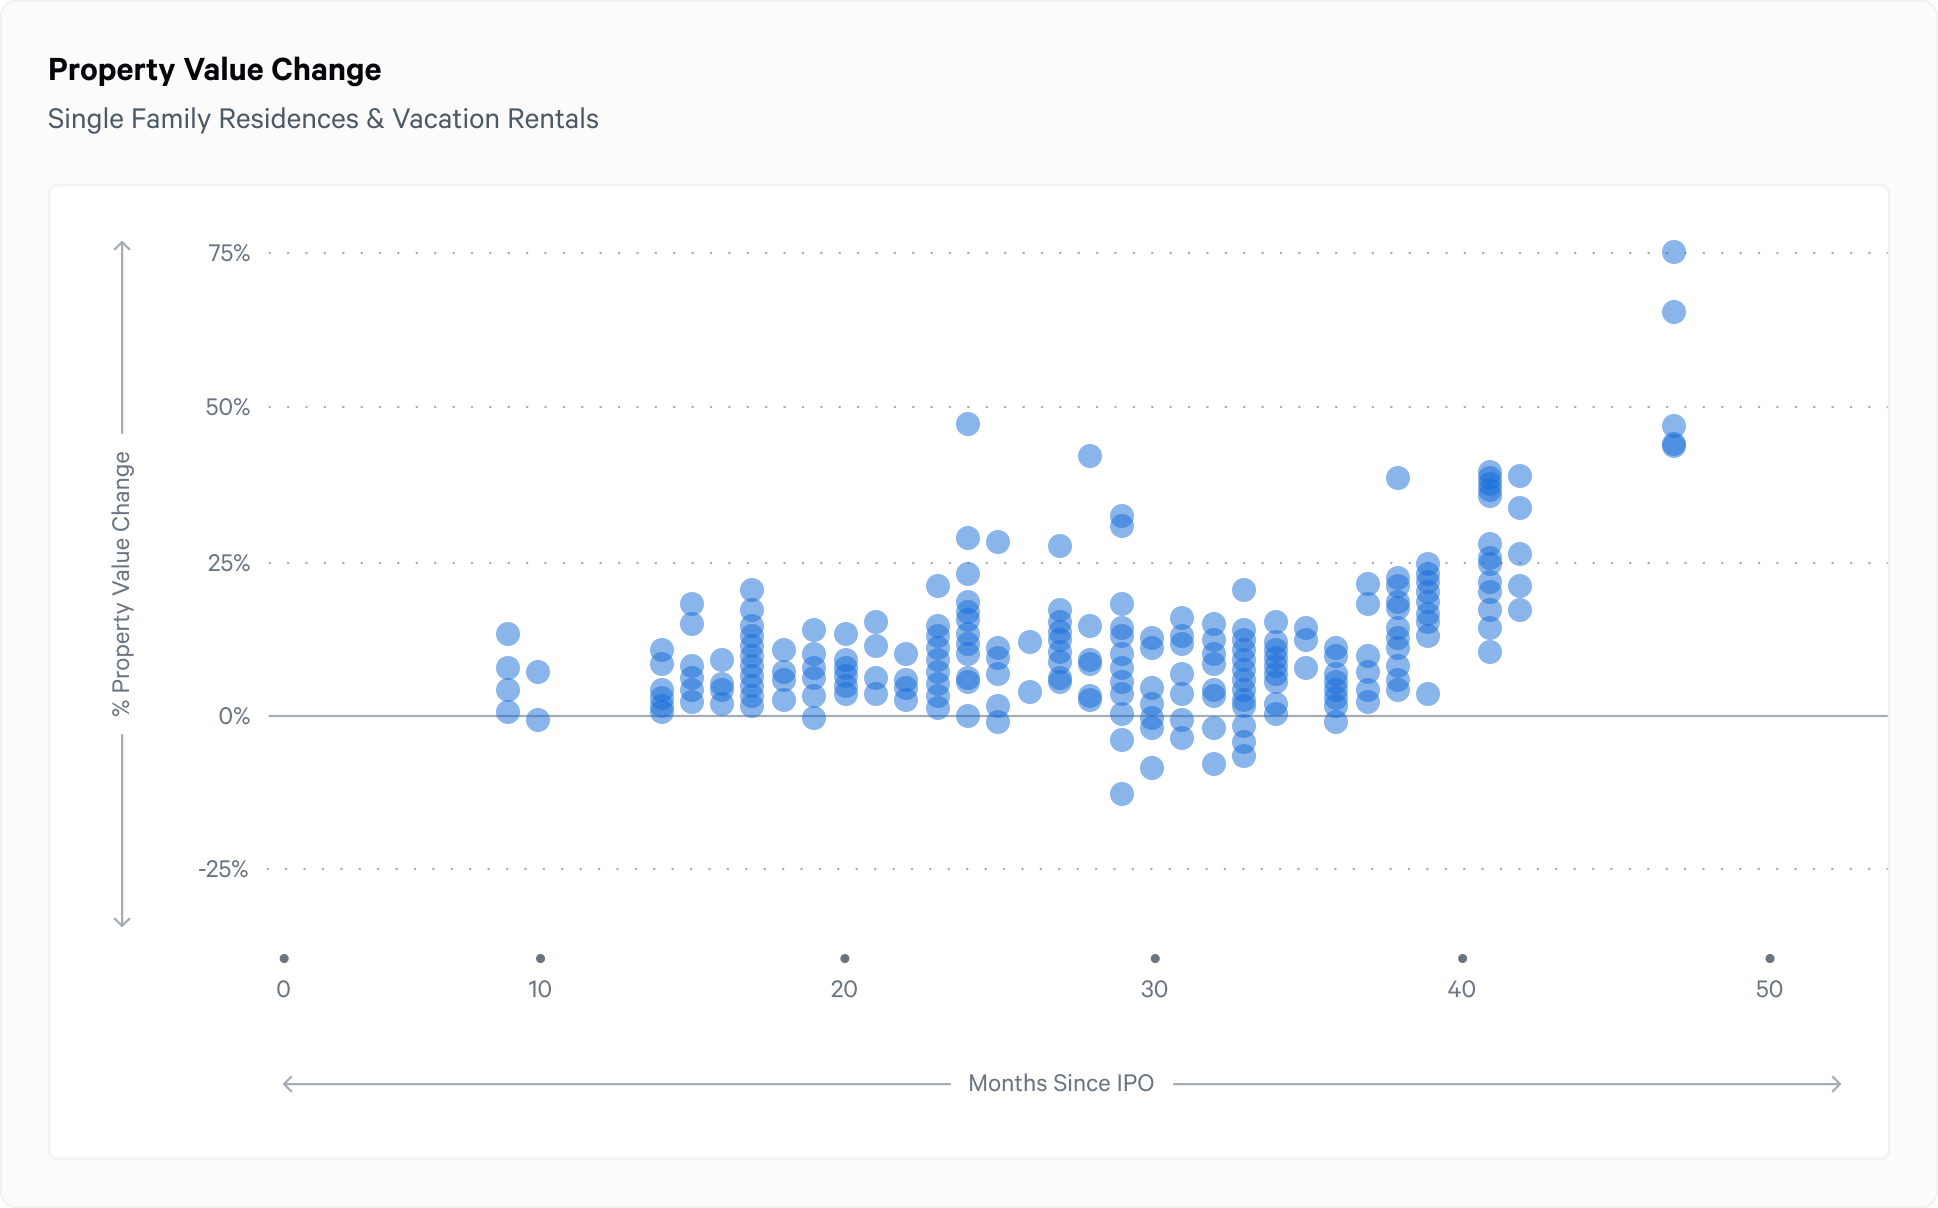
The chart below shows the combined realized dividends and unrealized appreciation of single family residential and vacation properties.
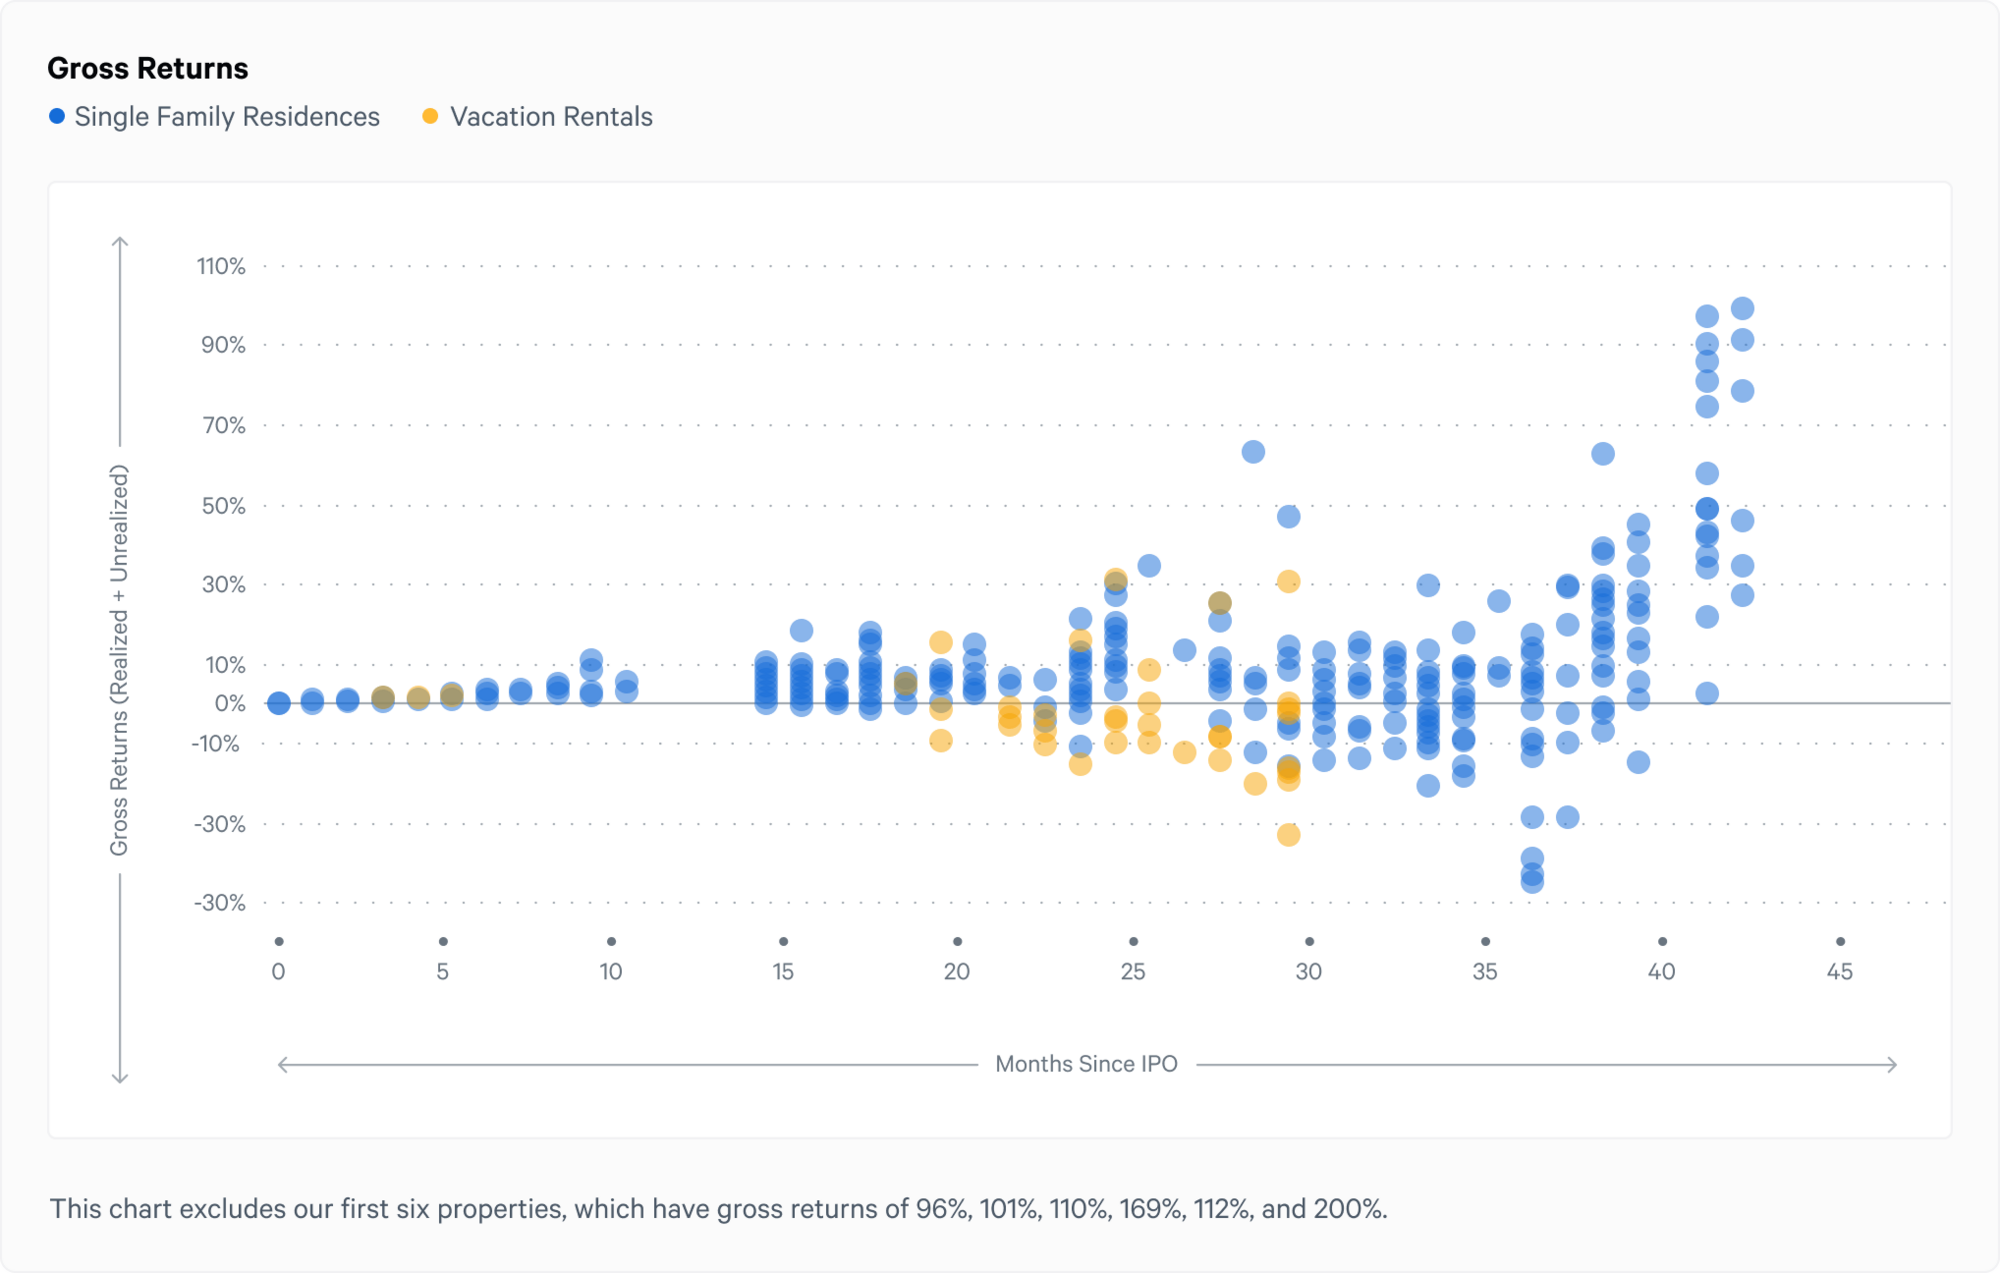
Properties may have lower total returns in the first six months because they have only received dividends and have not received an appreciation update. Historically, rental property investments have performed best when held for the long term.
This chart illustrates the potential benefits of diversification and dollar-cost averaging in the real estate market. Diversifying your portfolio by investing in a mix of single family residential properties, vacation homes, and debt and equity products, such as the Arrived Real Estate Income Fund and the Arrived Single Family Residential Fund, can be an effective strategy for mitigating risk.
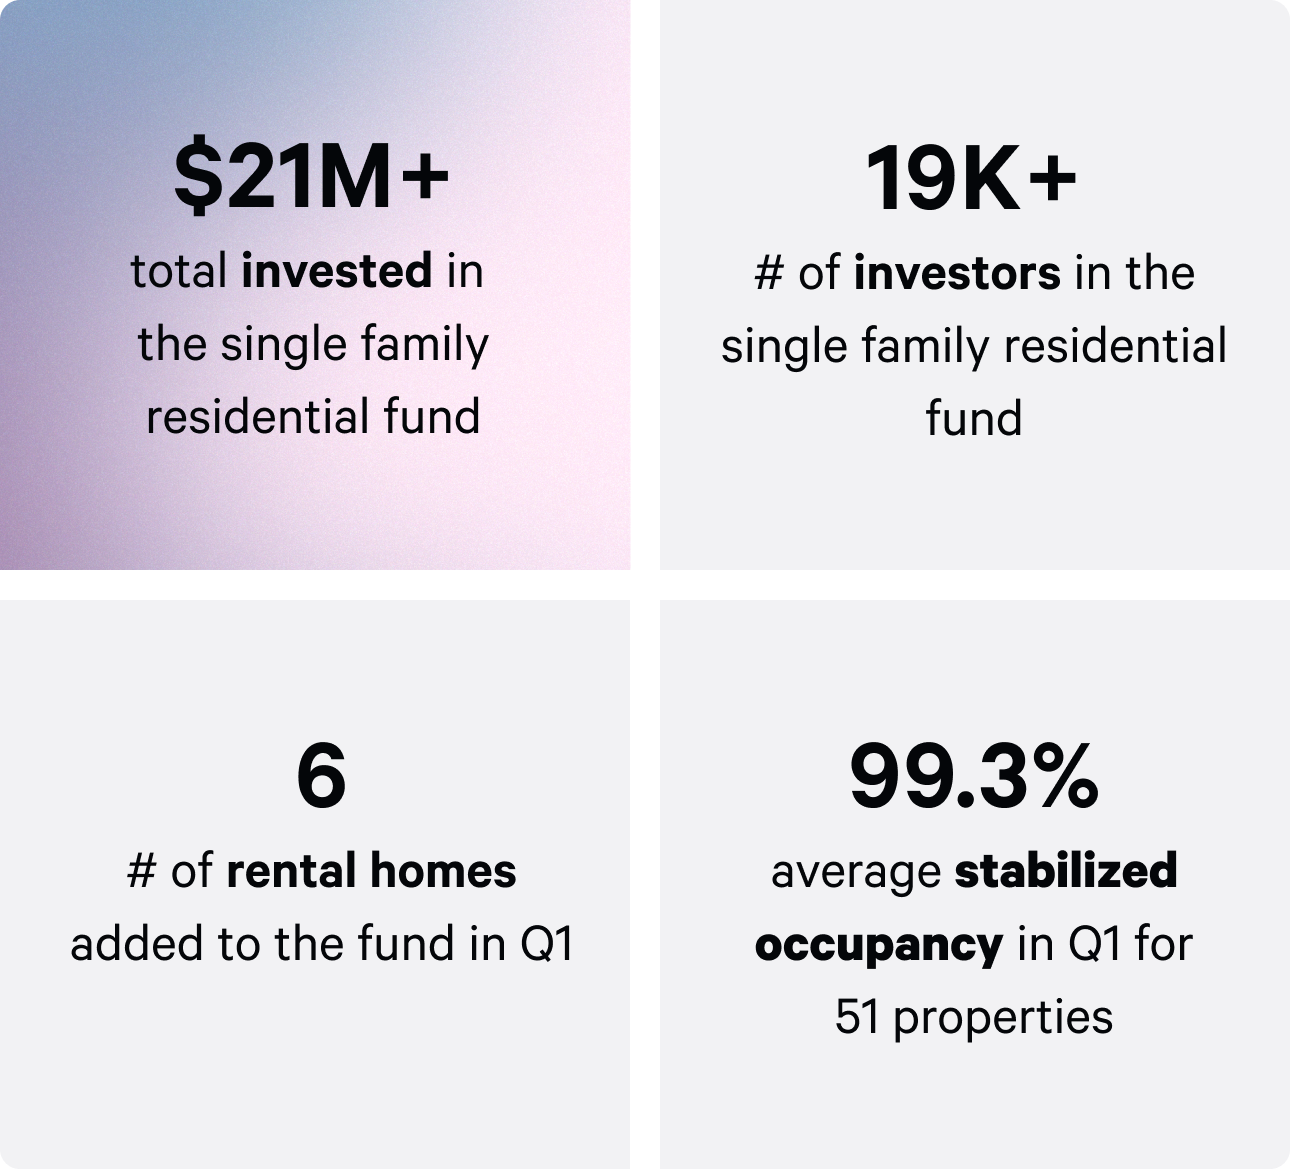
In Q1 2025, 55 Arrived Single Family Residential Fund properties contributed to an average annualized dividend of 4.0%.
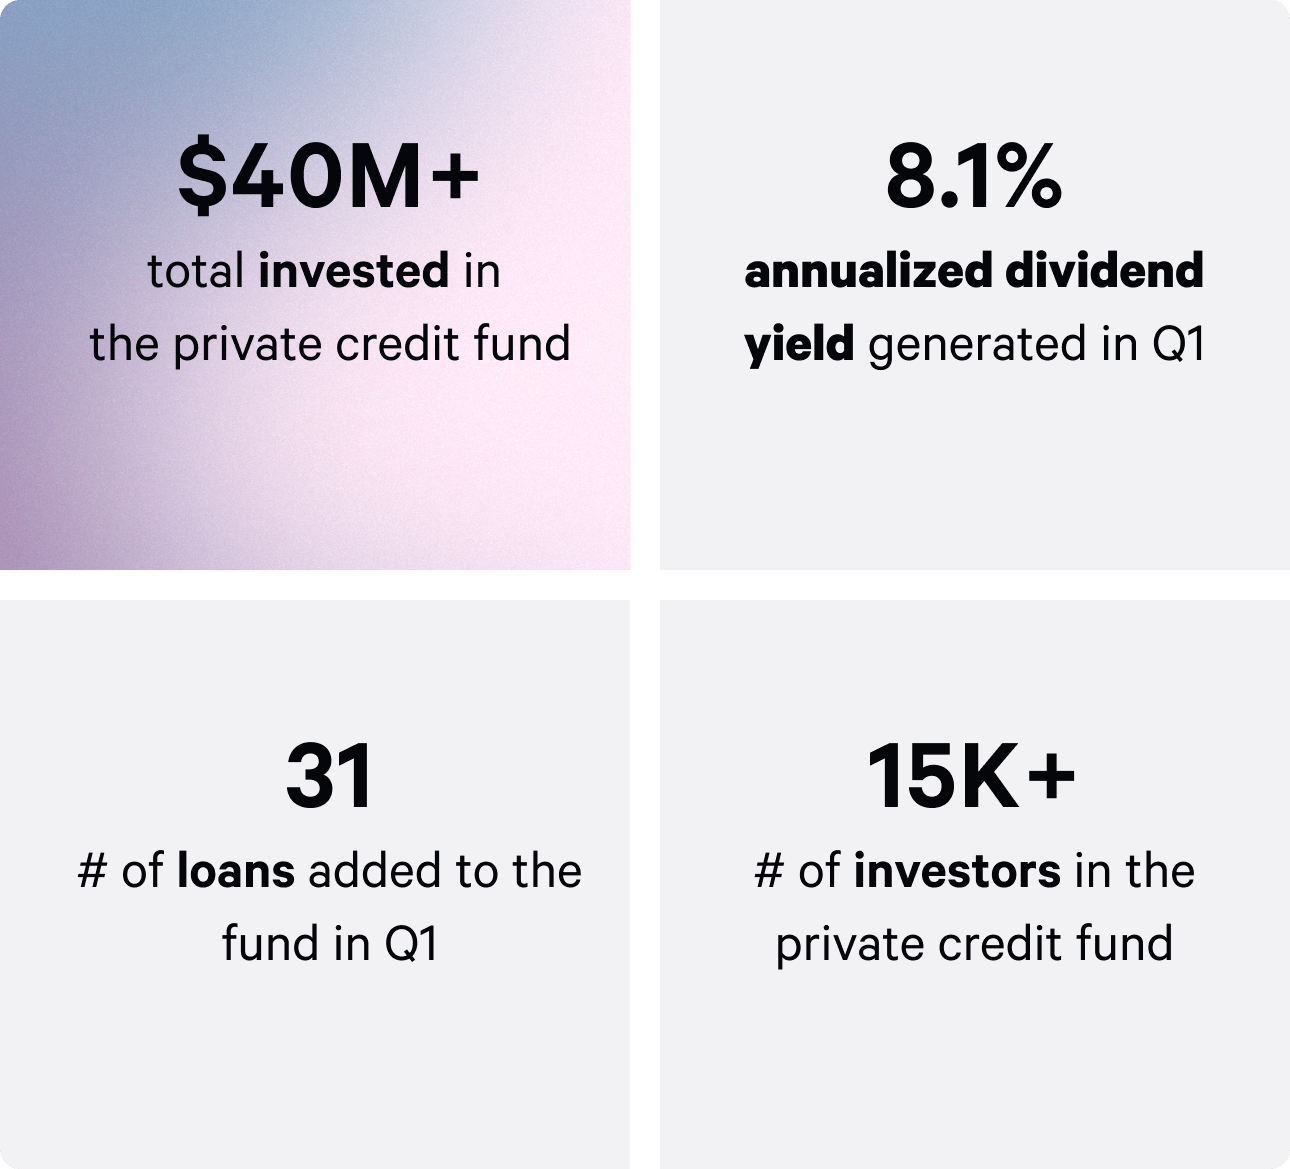
The Arrived Real Estate Income Fund generated income in Q1, resulting in a dividend payment in April at an 8.1% annualized rate. To date, more than $39M has been invested in the fund. The Real Estate Income Fund added 31 new loans in Q1 2025.
Introducing new ways to track your investment performance
In addition to introducing monthly account statements and a new map view that allows investors to visualize how their investments are spread across different markets, clients can now track performance using two updated metrics: Property Value and Arrived Valuation (formerly Share Price).
Both metrics are now available on your Portfolio Page and will be included in quarterly performance reports moving forward.
Property Value = Estimated market price of a property
- What is it? Property Values reflect the estimated market value of each property, similar to Zillow’s Zestimate or a Redfin estimate, and serve as a key input in calculating the Arrived Valuation.
- Where to find it: You can view the estimated Property Value and its percentage change for each investment directly on your Portfolio Page.
Arrived Valuation = Property Value + Assets - Liabilities
- What is it? Arrived Valuation—formerly known as the Arrived Share Price—represents our best estimate of the current value of each share. It’s calculated using the estimated market value of the underlying asset, along with the LLC’s overall financial position, including any assets and liabilities such as cash reserves, outstanding loans, and amortized expenses.
- Where to track it? You can find the Arrived Valuation and its percentage change for each investment on your Portfolio Page.
Track the real assets behind your returns with property value data in your portfolio
As noted above, this quarter, we are introducing estimated property values, which can be tracked both on your portfolio page and in this quarterly report at an aggregate level. These property value estimates reflect the current market value of each home, similar to Zillow’s Zestimate or Redfin’s price estimate.
By tracking property values and changes over time, you can gain a better understanding of the movements in real estate prices and their long-term impact on your investment.
Below, you’ll find a chart that shows the estimated market value performance for the individual rental properties in the Arrived portfolio.
Track the estimated value of your investment over time with the new Arrived Valuation
As we prepare for the launch of the Arrived Secondary Market, we’re implementing a key update to how we estimate the value of each investment on Arrived. Beginning with the Q1 2025 update, we’ll transition from using the term “Share Price” to “Arrived Valuation”—a change in both name and methodology that better reflects the current estimated value of your investment rather than its potential future value.
Here’s a quick summary of what’s changing and why:
• Property value estimates: We’re now incorporating both comparable sales and income-based valuation (using investor cap rates) for single family residential homes—a method we already use for vacation rentals. This hybrid model provides a more balanced and realistic assessment of property values.
• Property valuation timeline: For single family residential properties, valuation updates will now occur 12 months after the initial property funding. This extended timeline allows more time to gather rental and market data, resulting in more accurate and informed valuation estimates.
• Improvements & FF&E amortization: Property upgrades and furnishings (like new HVAC systems or a new roof) will now follow customized amortization schedules, better matching their actual useful life. Previously, all such costs were amortized over five years, regardless of asset longevity.
• Disposition costs: We’re removing projected property disposition costs from the current valuation. While we’ll continue working to minimize exit costs in the future, investors clearly told us that applying these estimates universally—regardless of hold period or individual preferences—reduced clarity. Now, the Arrived Valuation reflects today’s estimated value, not assumptions about potential future sales.
• Series fees & expenses: Future offerings will adopt updated amortization timelines, matching the loan’s fixed rate term or 5 years (whichever is greater). Properties without financing will use a 10-year schedule to better reflect long-term asset value.
• Hold period estimates: Our hold period assumptions are evolving to match more realistic investment durations and secondary market flexibility. Fixed-rate financed homes will align with the loan term (e.g. 5–10 years), while fund and unleveraged properties will follow extended timelines (5–15+ years).
You can read more about Arrived Valuation here.
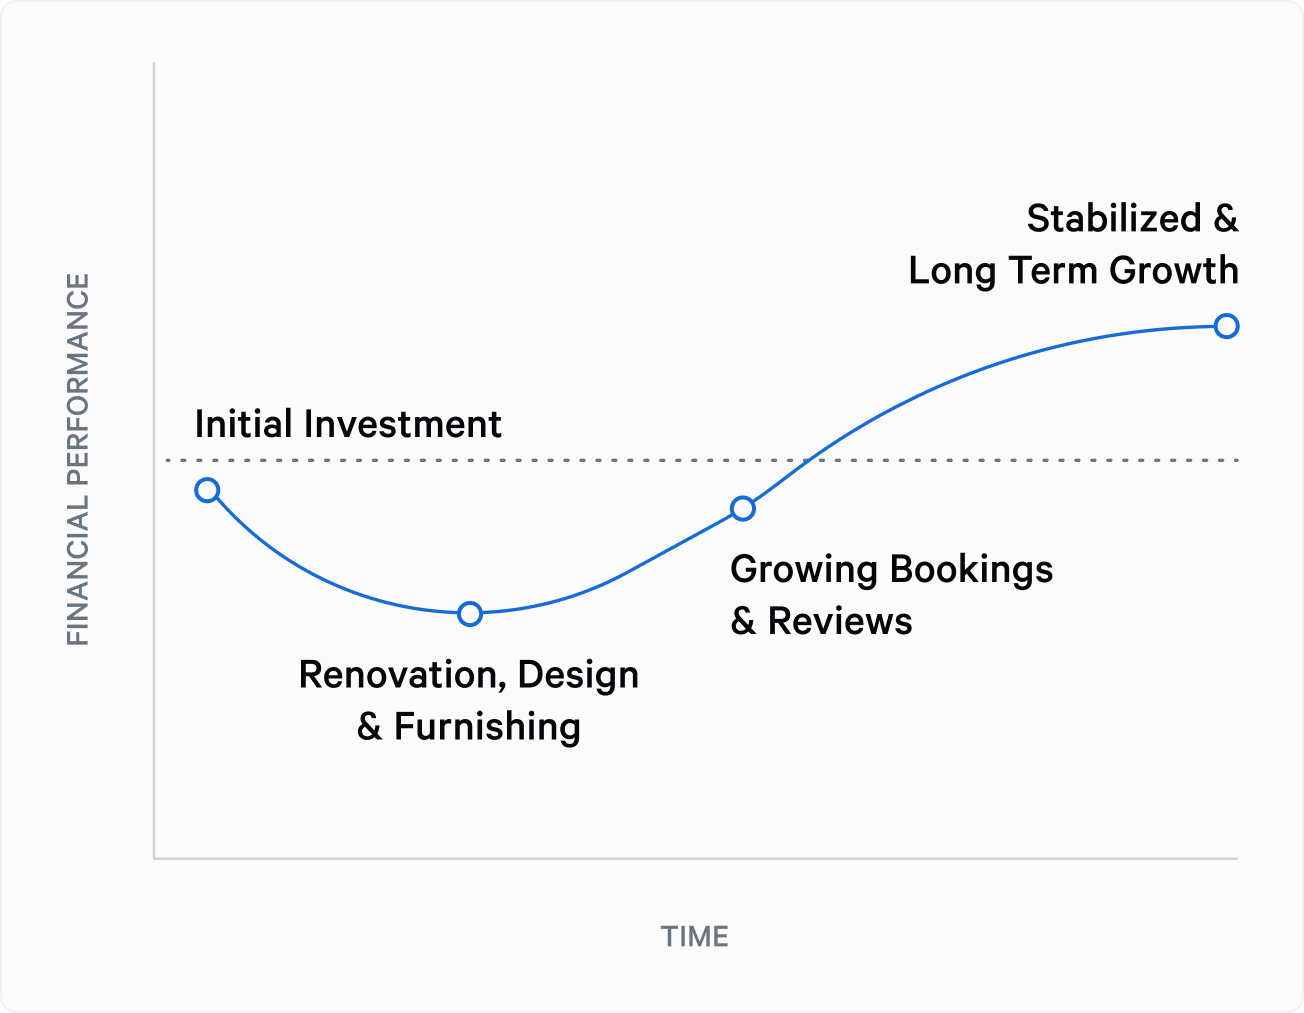
Understanding Unrealized Negative Appreciation: Real Estate Is a Long Term Investment
When considering rental share prices, it's crucial to understand the high initial costs and longer ramp-up time needed to increase the potential for strong income performance.
In the early stages of investing in a single family residential property, macroeconomic factors such as prevailing mortgage rates, the strategic use of leverage, and the prevailing market prices of homes can significantly impact initial total returns.
This process follows the investment J-curve pattern. Larger upfront investments in things like property improvements can be accompanied by initially lower dividends or share prices. This dip represents the low point of the J-Curve. As the property stabilizes, returns can increase, reflecting the growth period of the curve. It's important to remember that real estate tends to perform best as a long-term investment, allowing investors to navigate through various market cycles and maximize the potential for returns.
Operational performance
Single Family Residential stabilized occupancy
Arrived closed Q1 2025 with an average stabilized occupancy rate of 95%² for the single family residential properties in operation during the quarter. This was helped by 44 new leases started in Q1. It’s also worth noting that the average term on these leases was 23 months, with 30 leasing above forecasted rent.

Vacation Rental performance
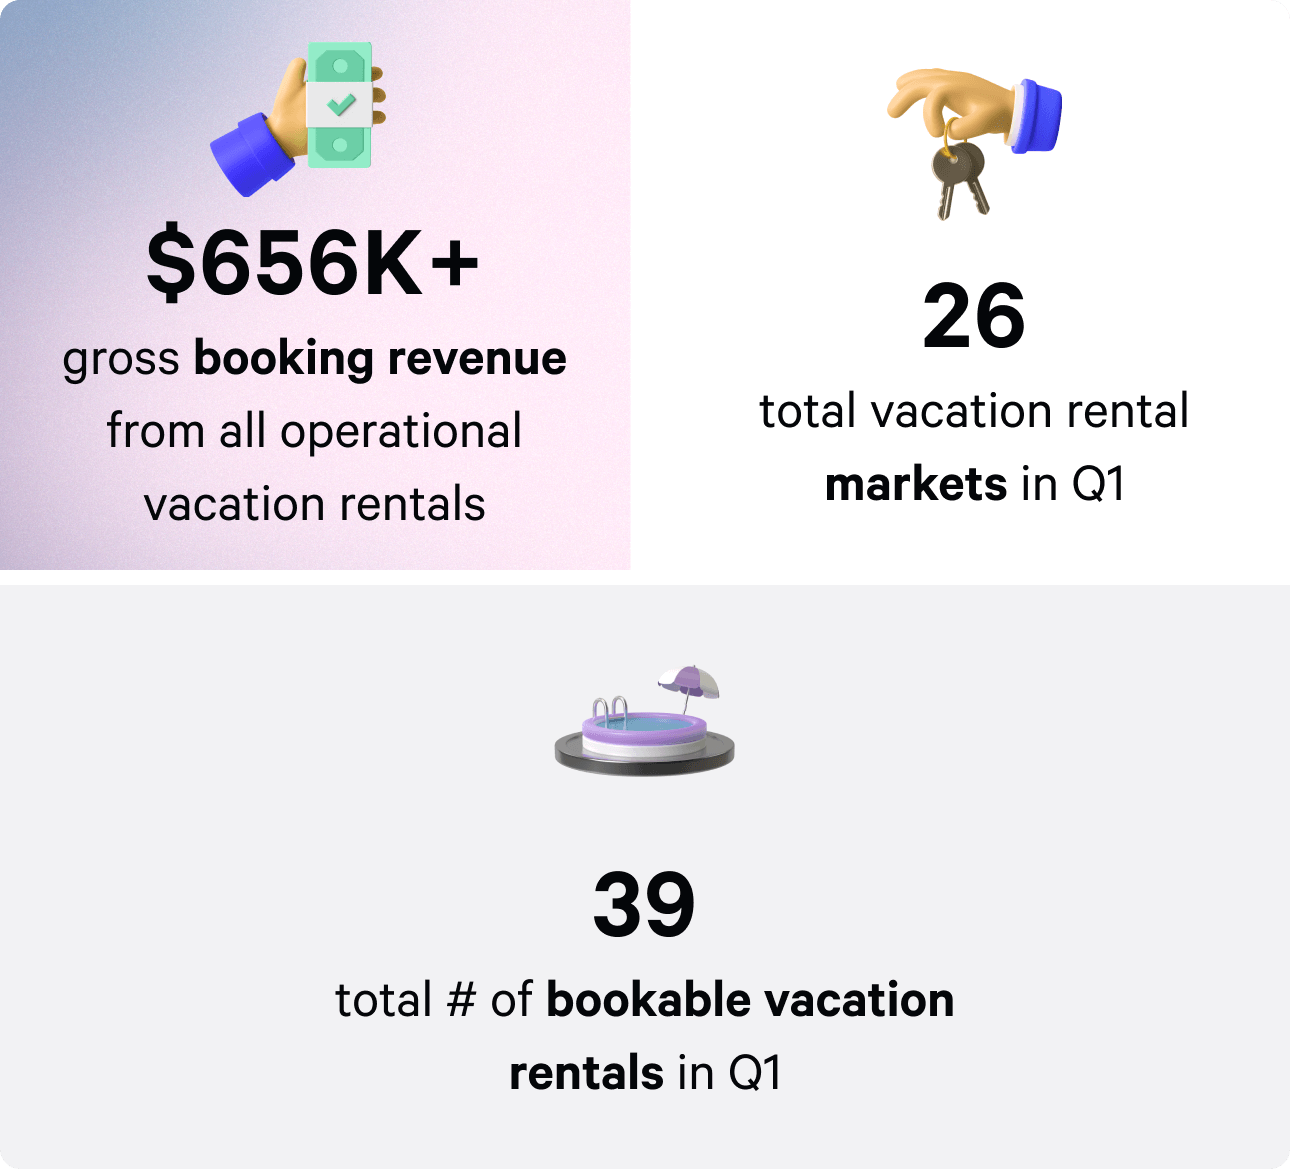
In Q1 2025, there were 39 bookable vacation rental properties. Here are some highlights from the quarter for this asset class:
- $656,376 in gross booking revenue across all operational vacation rentals in Q1³
- 26 total vacation rental markets as of Q1 2025
- Q1 2025 ended with an average guest rating of 4.95 out of 5.0 stars⁴

In Q1 2025, 39 vacation rentals were in operation. The gross booking revenue and average guest rating for each rental are below. Gross booking revenue is reported before any deductions for the property management fee, operating expenses, and repairs and maintenance expenses.
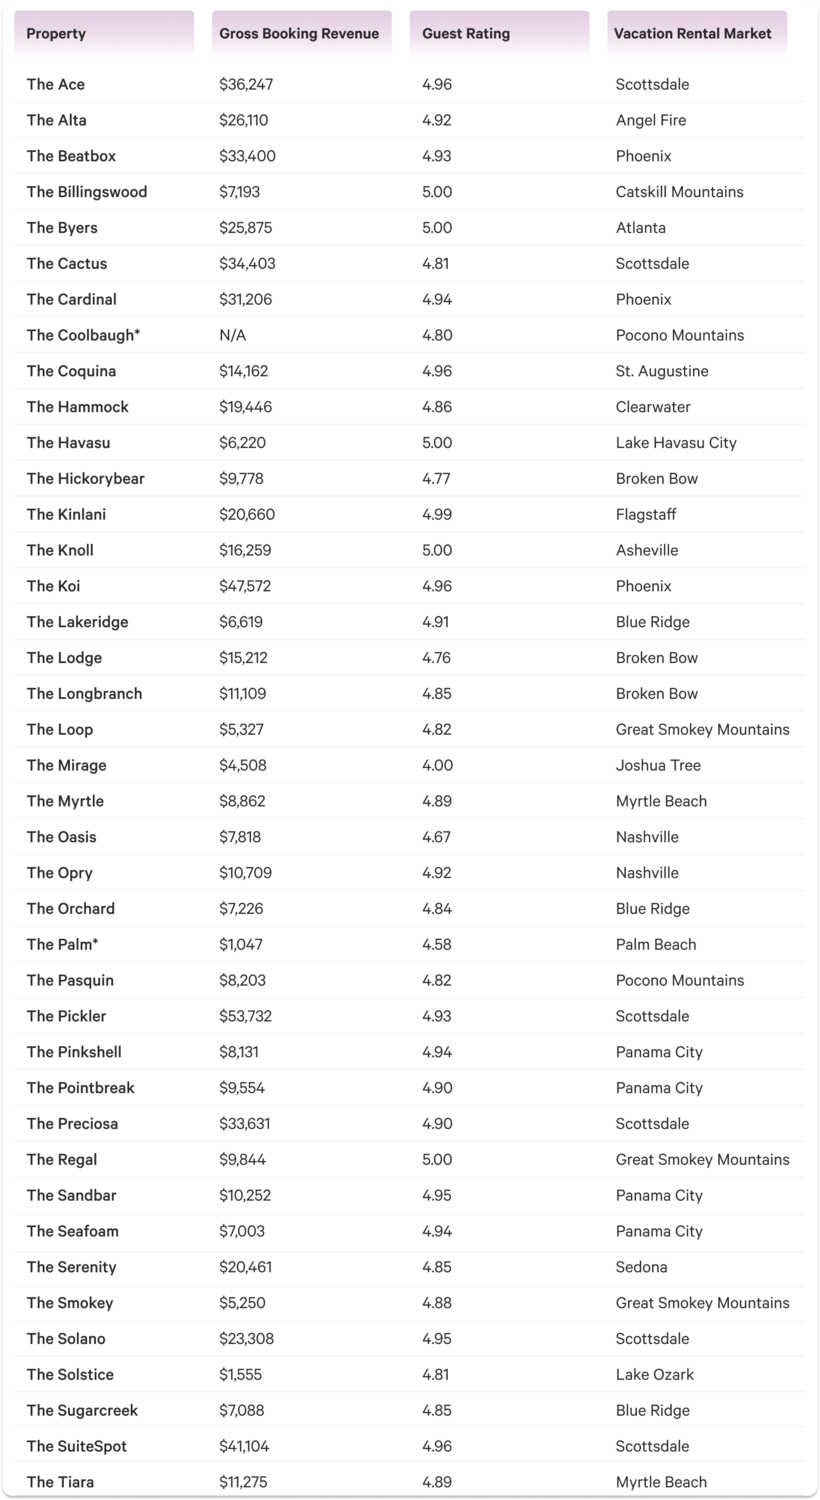
*Booking revenue was impacted due to a maintenance issue.
See the Property History Timeline for individual updates for each property.
Want to stay at an Arrived vacation rental? Add it to your Airbnb wishlist ✨
Arrived Single Family Residential Fund Occupancy
Arrived closed Q1 2025 with an average stabilized occupancy rate of 99.3%² for the properties in operation in the Arrived Single Family Residential Fund during the quarter. This was helped by the start of 1 new lease in Q1.
Closing Thoughts By Arrived VP of Investments, Cameron Wu
U.S. residential real estate faces a challenging yet opportunistic environment shaped by new economic policies and sustained higher interest rates. We are already seeing behavioral changes in the home-building space. Tariffs increase material costs, prompting builders to either reduce output or increase prices to protect margins. However, affordability pressures, exacerbated by tariffs and elevated mortgage rates, temper demand and make aggressive construction a risky endeavor.
Despite these challenges, the market’s fundamentals remain robust, as there is still a general undersupply of homes, combined with the Millennial cohort’s strong demand as they enter their peak home-buying years. This structural imbalance—scarce supply against steadfast demand—underpins price resilience. Real estate’s proven durability through economic cycles reinforces its dual role as a consumption asset and an inflation hedge.
Despite these concerns, rental demand has remained strong, and credit returns have been consistent. Our long-term rental portfolio achieved an average stabilized occupancy rate of 95.3%, rivaling that of large public REITs. Our real estate income fund delivered an 8.1% yield, nearly double the current high-yield savings rate, with zero default on our portfolio.
Looking ahead, we are poised to launch the Arrived secondary market this year, providing investors unprecedented liquidity in real estate. This platform allows flexible exits without credit impacts or full asset sales, aligning with the market’s need for risk-mitigated investments in an uncertain economic environment.