Q3 2026 Highlights
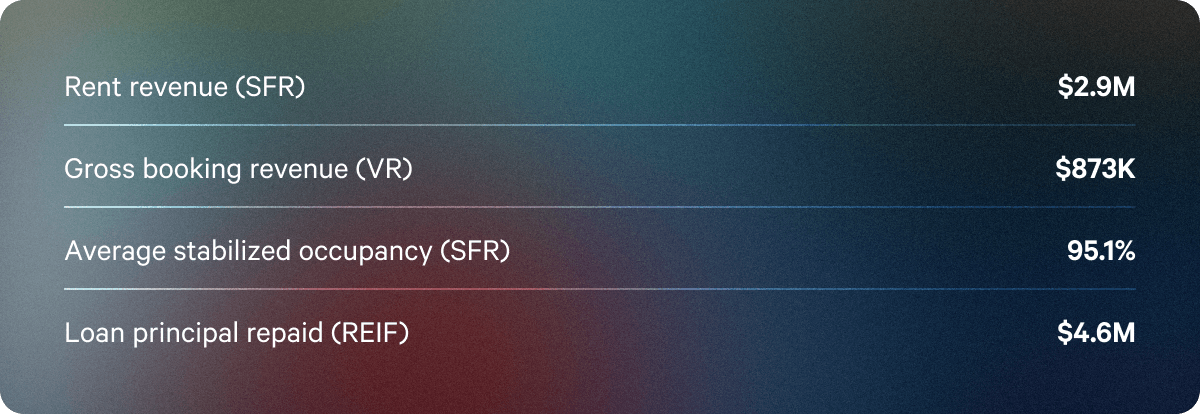
In Q3 2026, the portfolio moved from spring turnover into a steadier summer. Homes that turned over in the spring were re-leased, and stabilized occupancy across individual single-family residential properties rose to 95.1%, up from 91.8% in Q2.
Arrived distributed approximately $4.2M in dividends across all offerings in Q3 2026.
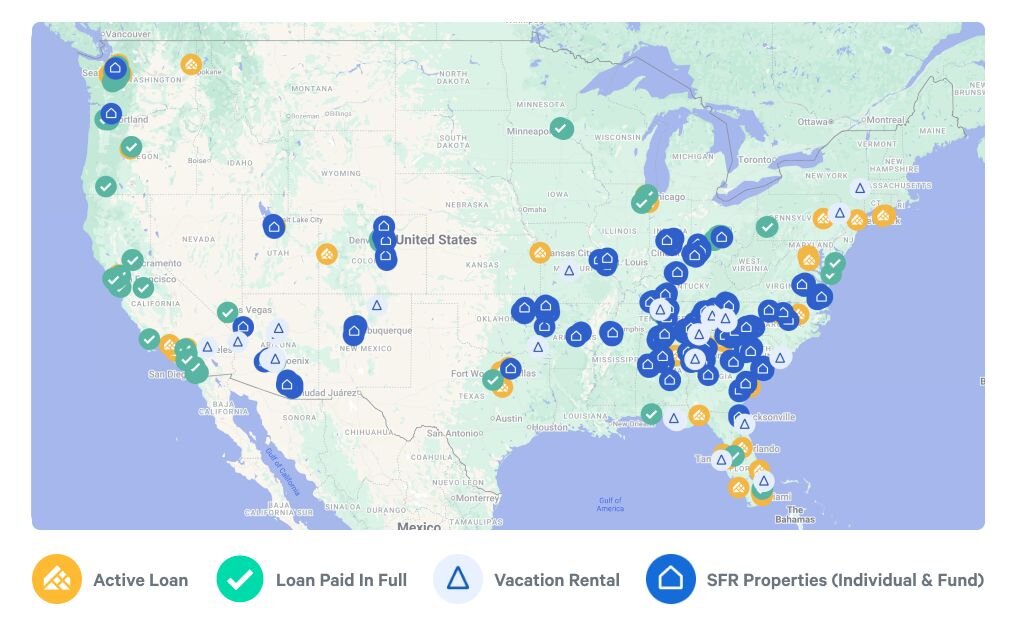
Below is the geographic diversification of single-family residential, vacation rental, and real estate-secured credit offerings in the Arrived portfolio.
Market commentary
Interest rates remained volatile in Q3 as markets reassessed inflation and the Federal Reserve's next steps. In our Investments team's view, elevated mortgage rates continued to challenge housing affordability and lengthen borrowers' sale and refinancing timelines. Here is how those conditions showed up across the portfolio's equity and credit offerings.
On the equity side, our rental portfolio carries limited debt, and we can purchase homes with cash. That flexibility matters in builder negotiations, where our team is seeing more price reductions and credits as higher financing costs put pressure on sellers. Recent offerings reflect those terms. We acquired five single-family homes, launched as offerings between July and September 2026, with builder price reductions and credits ranging from $12,364 to $53,856 per home. These concessions lowered each home's purchase price, and the savings allowed us to waive property management fees on those offerings for one to three years. A lower acquisition basis and lower operating expenses during the waiver period may increase the cash available for distributions to investors, though actual results will depend on rents, occupancy, and other expenses.
In the existing portfolio, occupancy followed a seasonal pattern. We intentionally schedule most lease expirations for spring and early summer, when rental demand is typically strongest. Homes that turned over during that window were re-leased, and stabilized occupancy rose to 95.1% across individual homes (from 91.8% in Q2) and to 92.7% in the Single Family Residential Fund (from 86.3%).
The same timing concentrates turnover costs in those months. Preparing a home for rent requires make-ready repairs and time between residents, and those costs, along with maintenance, financing, and administrative expenses, weighed on Q3 distributions. Some rent-producing homes retained cash to replenish reserves, fund repairs or capital improvements, or pay down debt, which reduced their distributions for the period.
On the credit side, our team sees healthy competition for high-quality loans, supported by securitization and other financing sources. The Real Estate Income Fund remained selective on pricing, prioritizing borrower strength, collateral value, and repayment plans when sourcing loans. That competition, along with lower portfolio leverage, constrained income: the Fund's annualized dividend yield averaged 7.5%, down from 8.8% in the previous quarter.
New offerings and platform enhancements
Q3 brought several updates across the Arrived platform, focused on giving investors a clearer view of their holdings.
Funded properties now have full detail pages.
Single-family and vacation rental properties keep a detail page after funding closes, showing dividend history, Arrived Valuation over time, property history, your position, and transaction history. When a property is in a secondary market trading window, eligible investors can place orders from the same page.
You can now view account balances over time.
The Portfolio page shows the combined value of your Arrived holdings and cash balance at the end of each month over the life of your account. Portfolio metrics now use the same timing as account statements, so figures are consistent across the platform.
Investors can place bulk sell orders on the secondary market.
During a trading window, investors can list multiple eligible positions in one flow and apply a single pricing approach (a discount to Arrived Valuation or a fixed price) across all of them.
Real Estate Income Fund loans now appear on the map.
The portfolio map shows Real Estate Income Fund loans alongside the properties you own, placed at the nearest city center to protect borrower privacy. The Fund's details page also maps its loans, showing which are active and which have been paid off.
Single Family Residential property performance
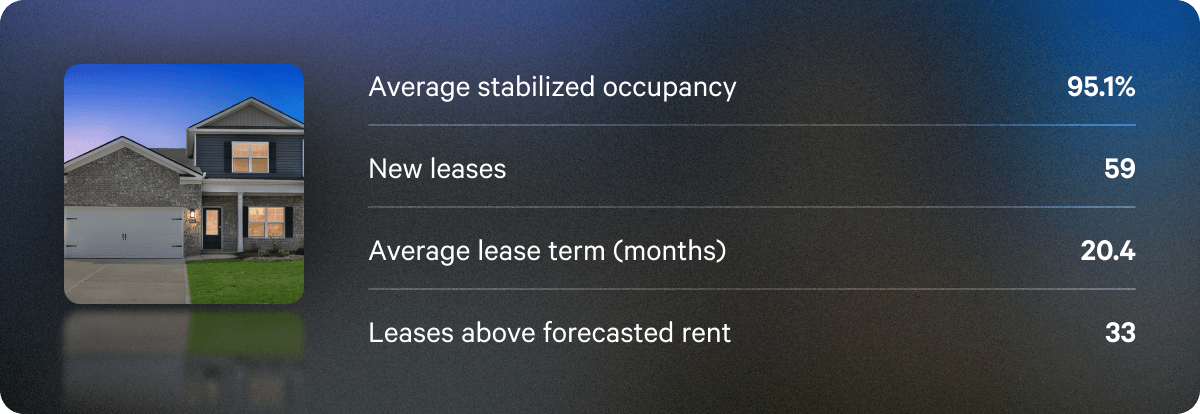
Occupancy recovered this quarter as homes that turned over in the spring were re-leased. Stabilized occupancy across individual properties was 95.1% for Q3, up from 91.8% in Q2.
Leasing slowed, as expected after peak season. Individual properties signed 59 new leases in Q3, down from 172 in Q2, because lease expirations are intentionally concentrated between February and May. New leases averaged 20.4 months, with 33 signed above forecasted rent.
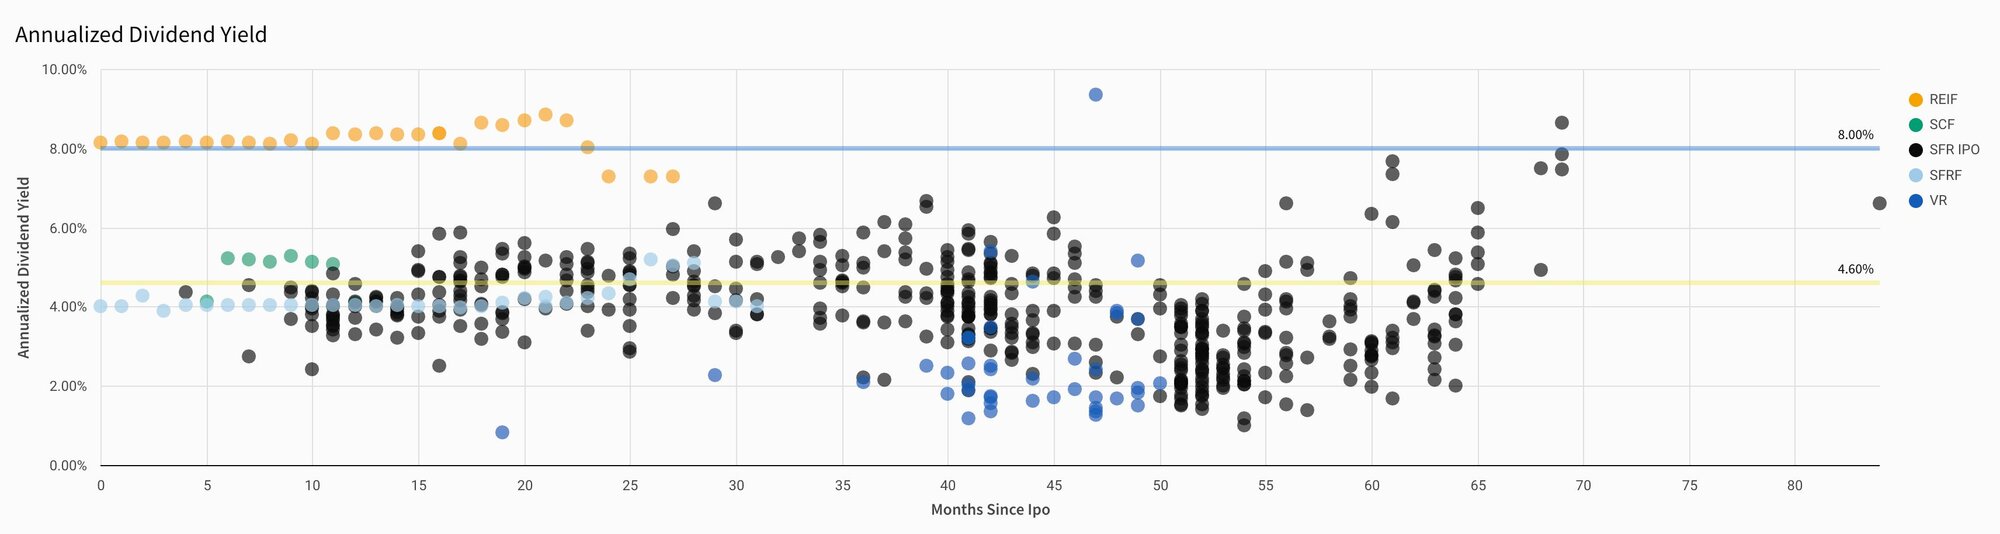
Across the three distributions paid July through September 2026 (reflecting May through July 2026 operating results), annualized dividend yields across individual single-family residential properties that paid a dividend ranged from 0.2% to 10.8%, with an average of 4.2%¹
The charts below show historical annualized dividend rates and total returns for individual single-family residential properties, vacation rental properties, and Arrived funds through the end of Q3 2026.
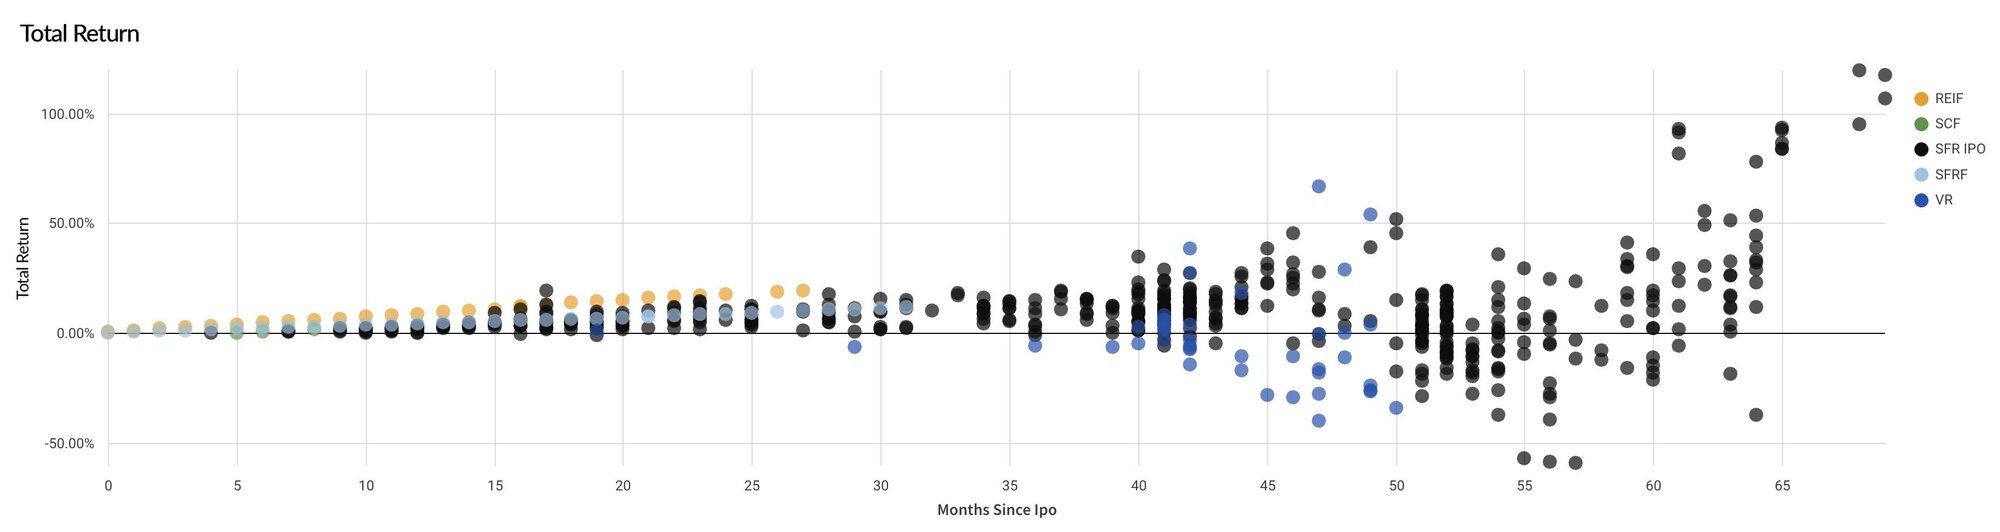
Total return is cumulative from each offering's initial offering and combines dividends paid with changes in share price based on Arrived Valuations. Appreciation is unrealized and does not reflect selling costs or other expenses that would be incurred on a sale.
Below is a chart showing the estimated market value performance of the individual rental properties in the Arrived portfolio.
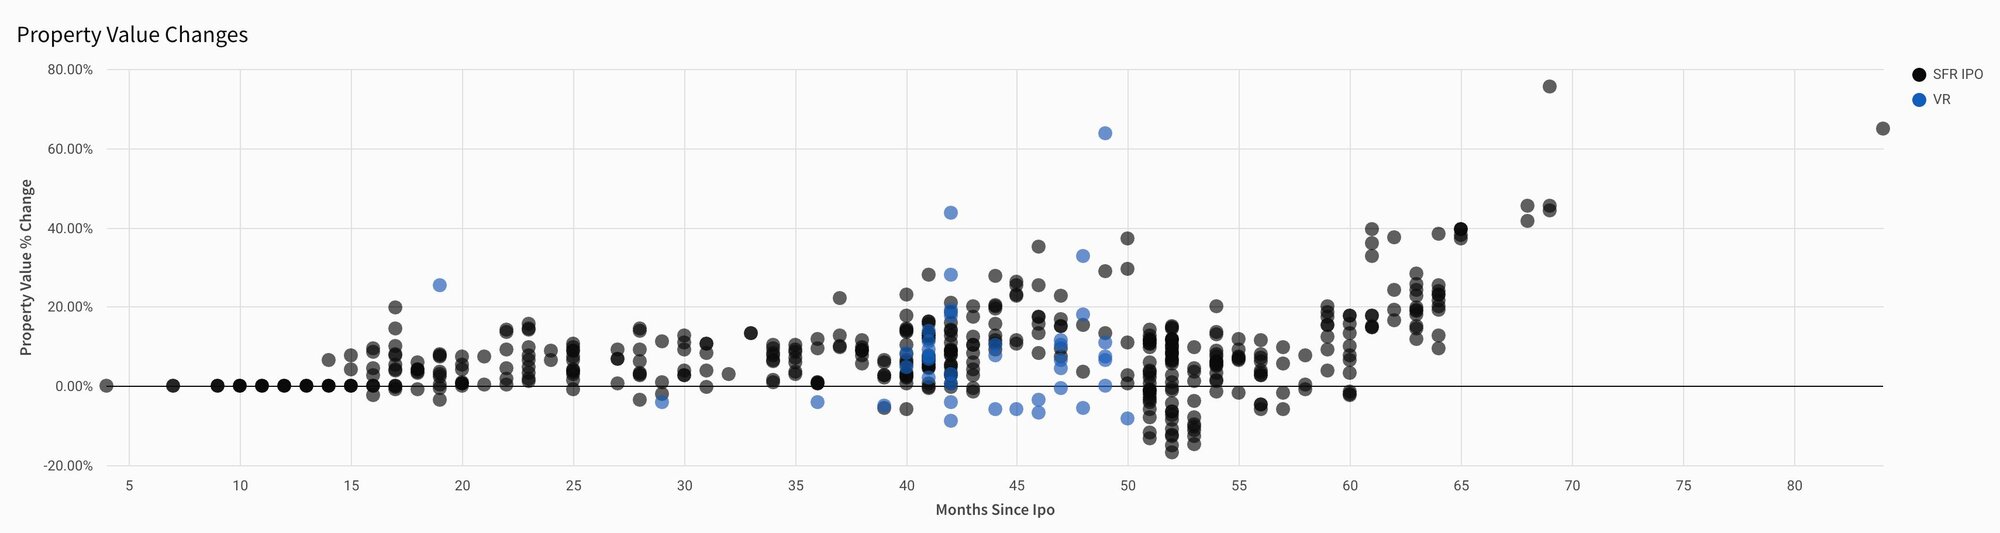
To view individual property performance and historical returns, visit the Arrived Returns page.

Equity fund performance
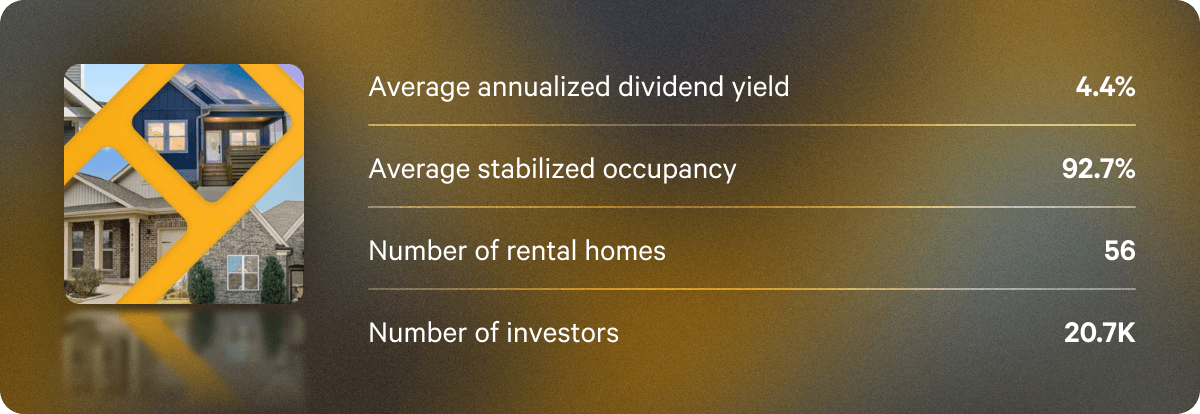
The Single Family Residential Fund's annualized dividend yield averaged 4.4% in Q3. Stabilized occupancy rose to 92.7% from 86.3% the previous quarter as homes that turned over during the fund's first major renewal wave were re-leased.
The fund spreads exposure across multiple homes and markets and evaluates each acquisition based on expected rent, ongoing expenses, local supply, and how it fits the overall portfolio.
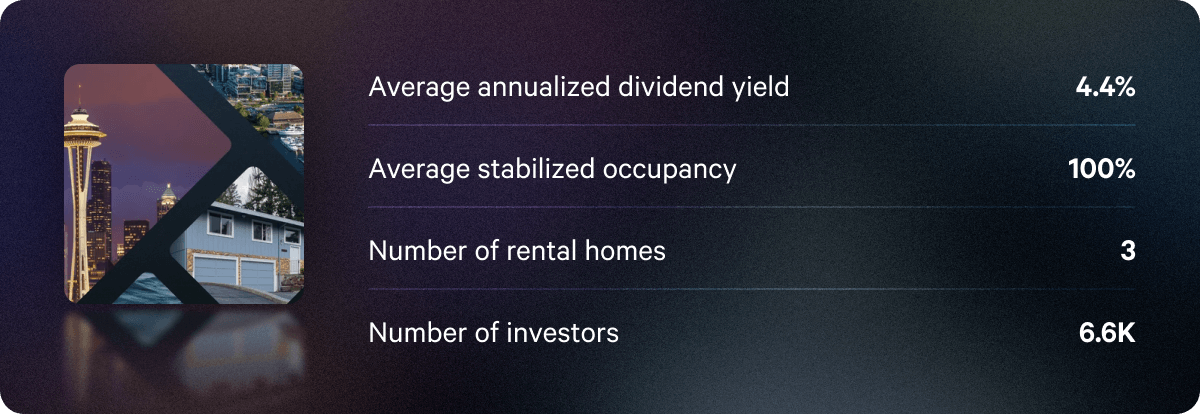
The Seattle City Fund's annualized dividend yield averaged 4.4% in Q3. Stabilized occupancy remained at 100% for the third consecutive quarter.
The fund gives investors exposure to Seattle-area residential real estate through rental homes, value-add multifamily, and real estate-secured credit. Each serves a different purpose: rental homes provide potential income and appreciation; the Olympic West Apartments investment offers an opportunity to create value through property improvements and operations; and credit investments are designed to provide potential income between property acquisitions. Performance remains tied to one regional market.
Real Estate Income Fund performance
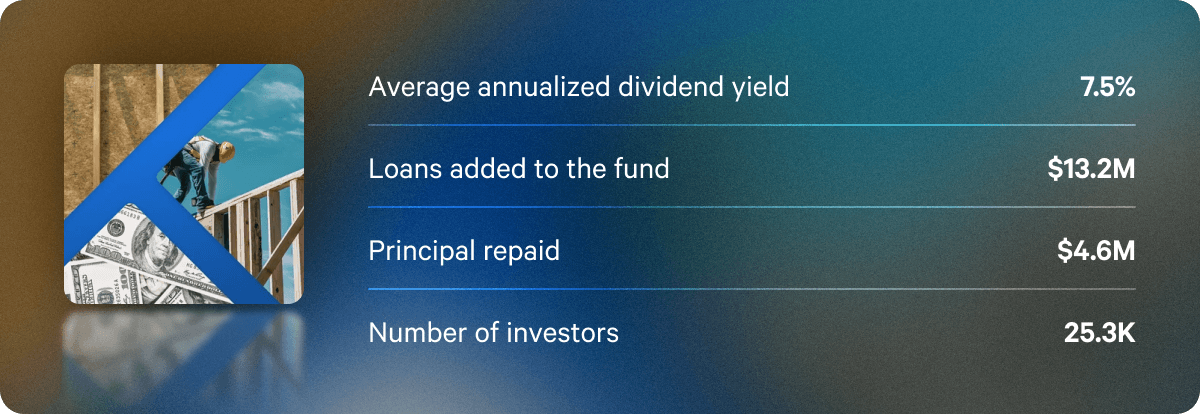
In Q3, the Real Estate Income Fund's annualized dividend yield averaged 7.5%, compared with 8.8% in Q2.
Two factors contributed to the lower yield this quarter.
First, the fund carried less leverage during the quarter. When the fund earns more on its loans than it pays to borrow, leverage can increase income on investor capital. But borrowing also adds interest costs and risk. If borrowing costs rise or loans underperform, leverage can reduce income and magnify losses. Using less leverage this quarter reduced both the additional income from borrowing and the associated risk.
Second, competition for high-quality loans remained strong. The fund stayed selective, investing only in loans that met its standards for pricing, borrower strength, collateral value, and repayment plans.
The Real Estate Income Fund remains focused on generating income through disciplined loan selection and active portfolio management.
In Q3, the fund added 1 new loan totaling $13.2M, received $4.6M in principal repayments, and closed the quarter with 37 active loans.
Vacation Rental performance
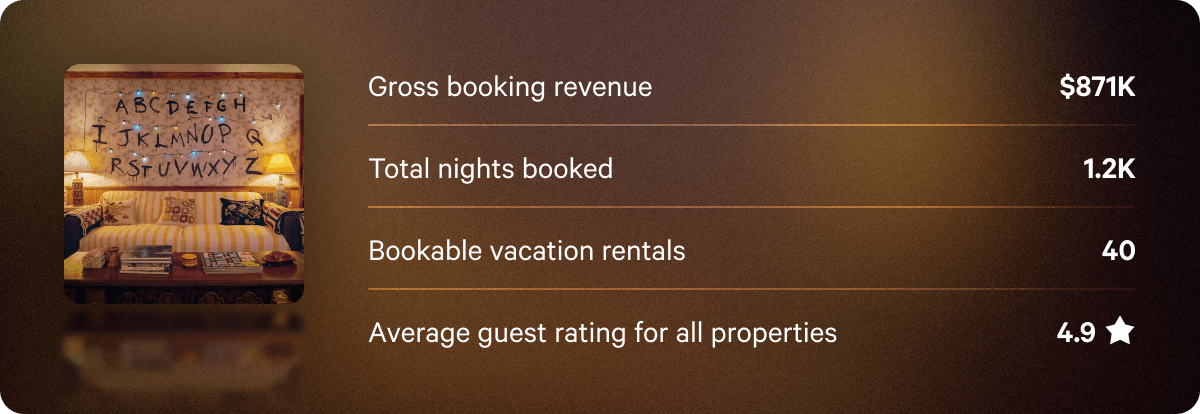
In Q3 2026, 40 vacation rental properties across 19 markets generated $871K in gross booking revenue and booked 1,227 nights. The portfolio ended the quarter with an average guest rating of 4.9 out of 5.
Across the three distributions paid July through September 2026 (reflecting May through July 2026 operating results), annualized dividend yields across vacation rental properties that paid a dividend ranged from 0.5% to 14.9%, with an average of 3.3%².
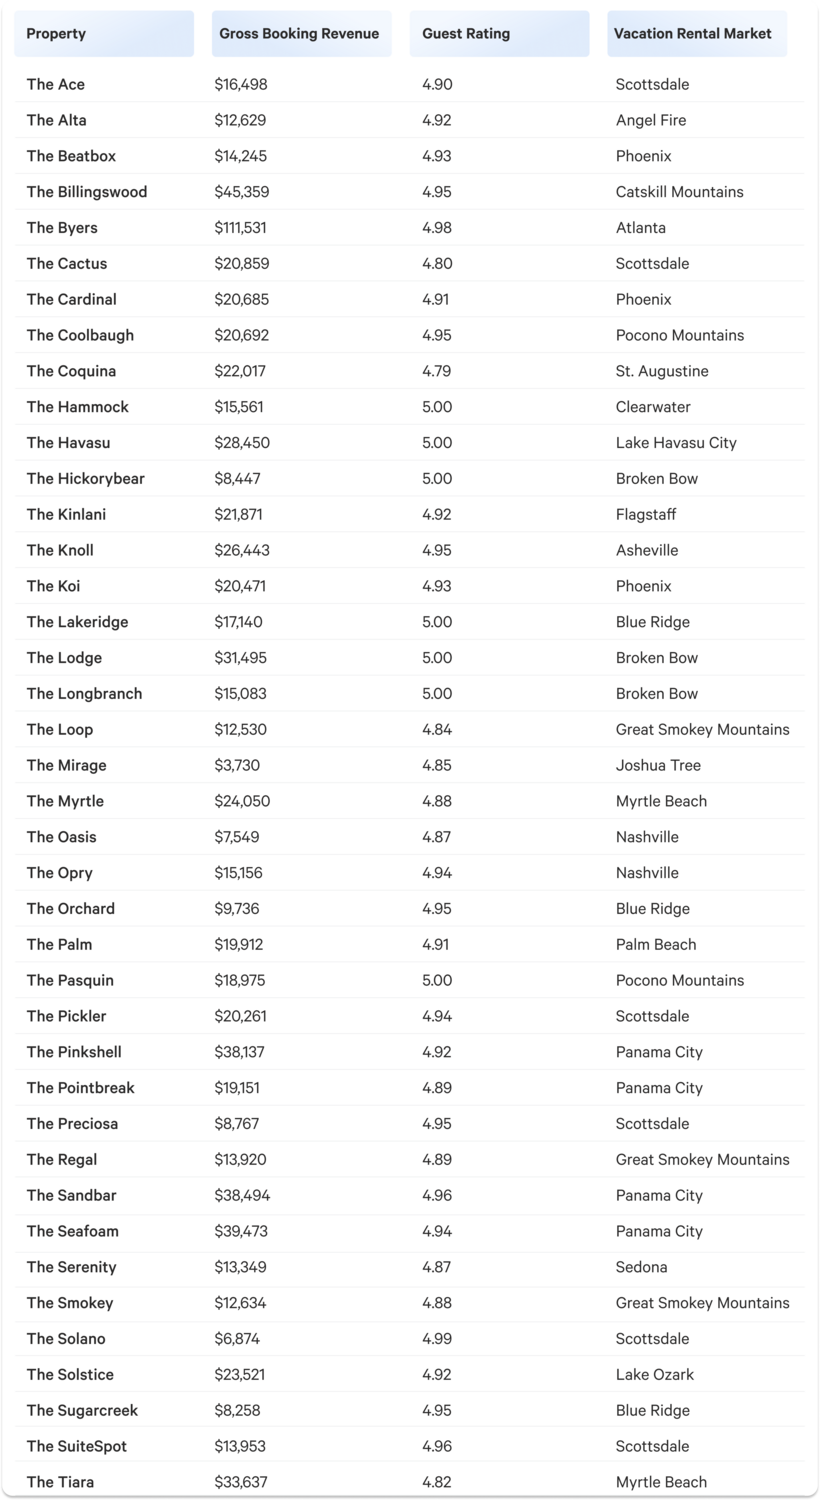
The table below outlines the gross booking revenue and average guest rating for each property. Gross booking revenue is presented before deductions for property management fees, operating expenses, and repairs or maintenance costs.
See the Property History Timeline for individual updates for each property.
Want to stay at an Arrived vacation rental? Add it to your Airbnb wishlist ✨
Closing thoughts from Arrived CEO, Ryan Frazier
“After some momentum to start the year, financial markets saw renewed uncertainty as interest rates and oil prices remained volatile. Inflation and the Federal Reserve’s rate decisions remain a focus.
Against this backdrop, our individual single-family homes moved through the summer leasing season and ended Q3 with stabilized occupancy above 95%. At the same time, mortgage rate fluctuations can affect short-term property values as homebuyers wait for lower mortgage rates.
Credit markets remain competitive, with securitization and other financing options supporting strong demand for high-quality loans. We continue to be selective, focusing on pricing, borrower strength, collateral value, and clear repayment plans. Lower borrowing levels have weighed on income, and we intend to increase borrowing selectively when attractive loans and financing terms align.
Looking ahead, we’ll continue to seek investment opportunities that we believe offer an attractive balance of risk and potential reward. We’ll remain selective with new credit investments while watching market conditions, and we plan to explore new types of investments that could offer investors opportunities for growth in the coming quarters.”